Scientific charts
Charts, parameters, and LaTeX tables on one screen.
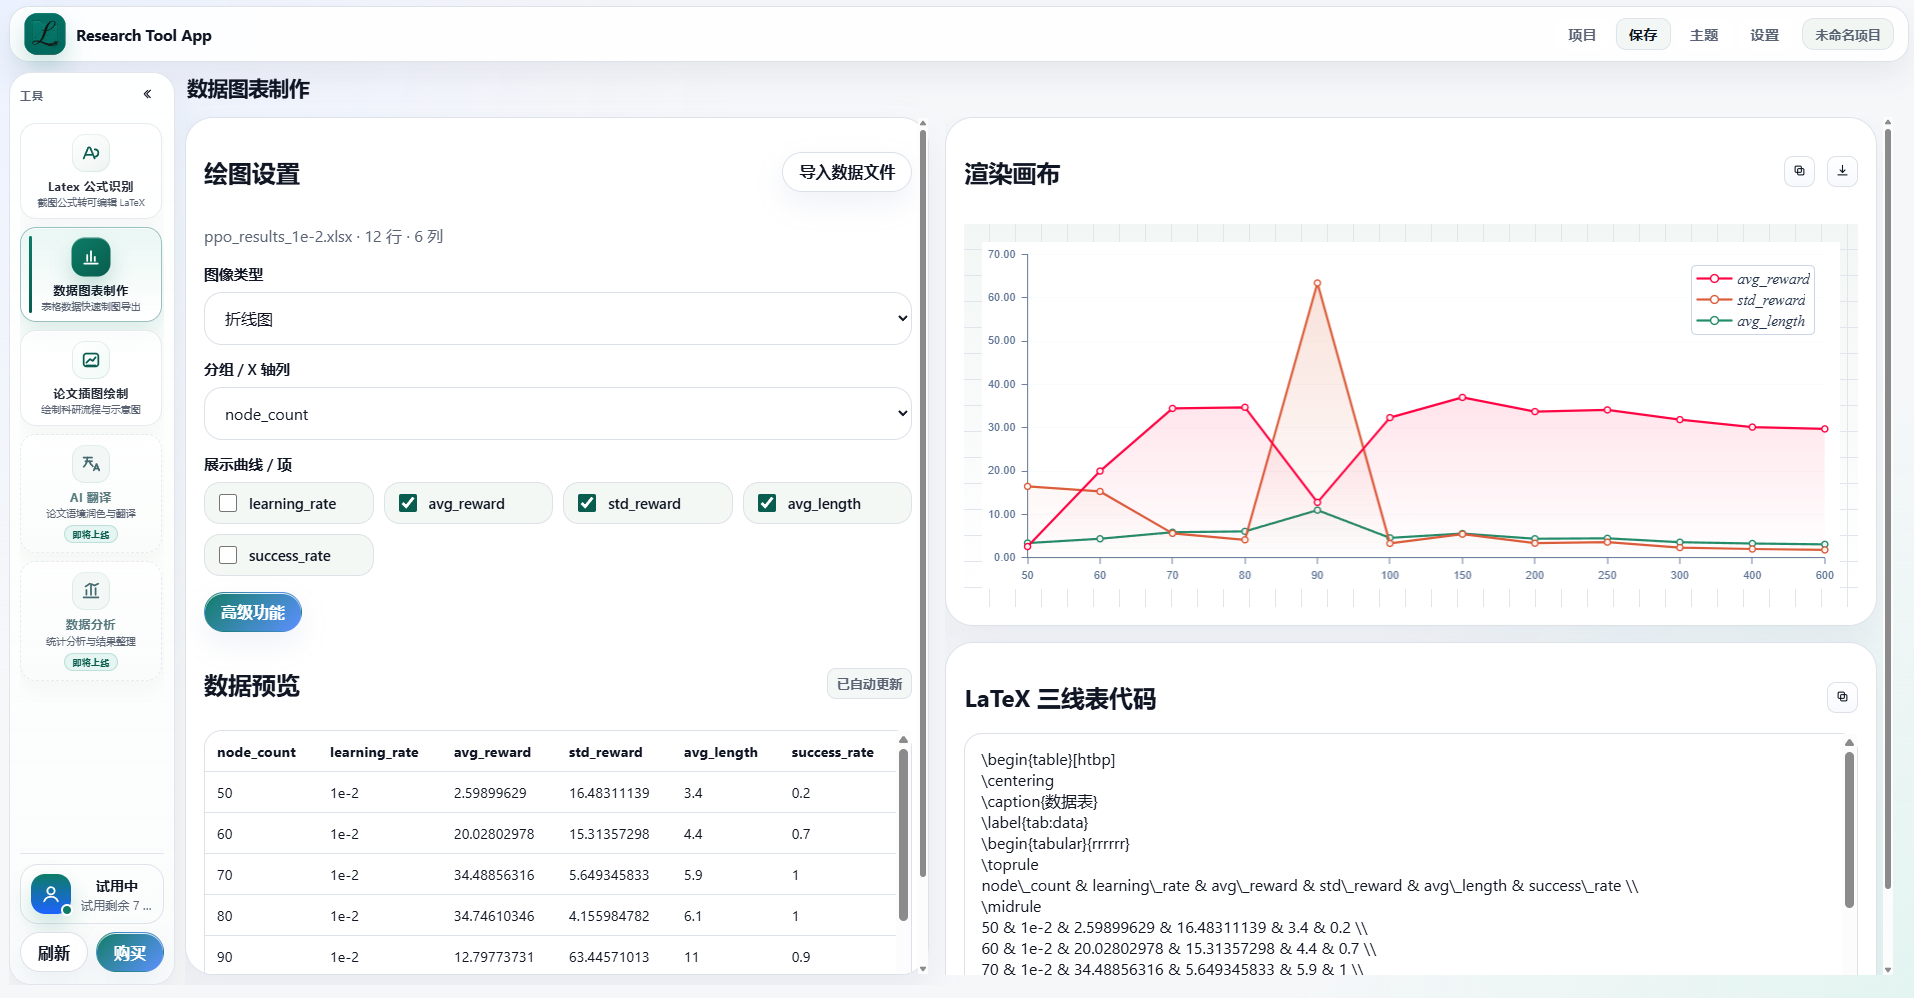
Research Tools helps you turn spreadsheet data into paper-ready charts. Tune chart type, curves, axes, legend, artistic styles, and area effects while generating LaTeX three-line table code in the same workflow.
Paper-ready result figures
From data to research charts.
The chart module is designed for experiment results, training curves, statistical summaries, and data comparisons. Import a spreadsheet, choose axes and series, then polish visual details from one parameter panel.
1
Import spreadsheet data and preview the table before rendering charts.
2
Use artistic styles and area effects to make line charts clearer and more layered.
3
Generate LaTeX three-line table code alongside the chart.